

Available soon
Grid and recovery expert advisors for MT4 and MT5, how they produce smooth equity curves, and the safeguards and account sizes to check before running one.
Expert advisors and indicators tagged for grid and recovery in our catalog.



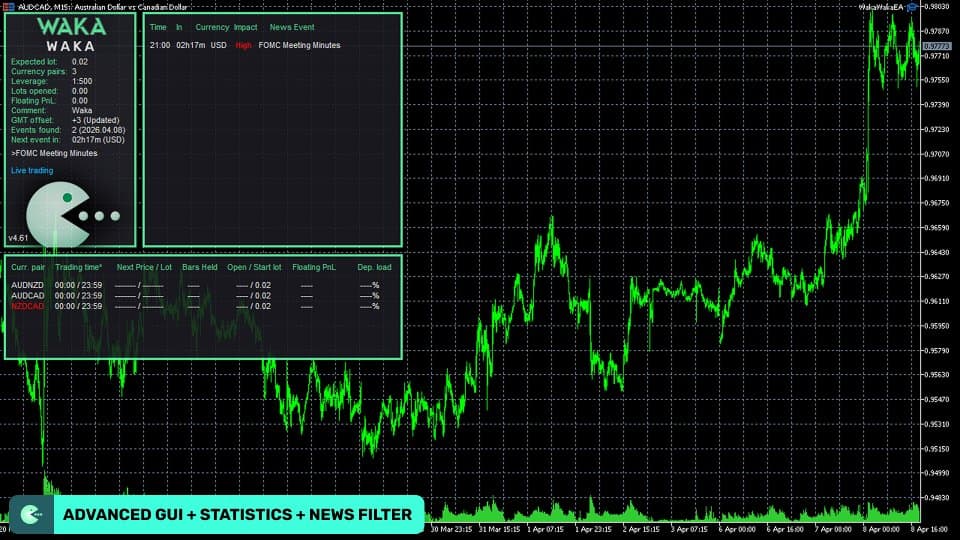

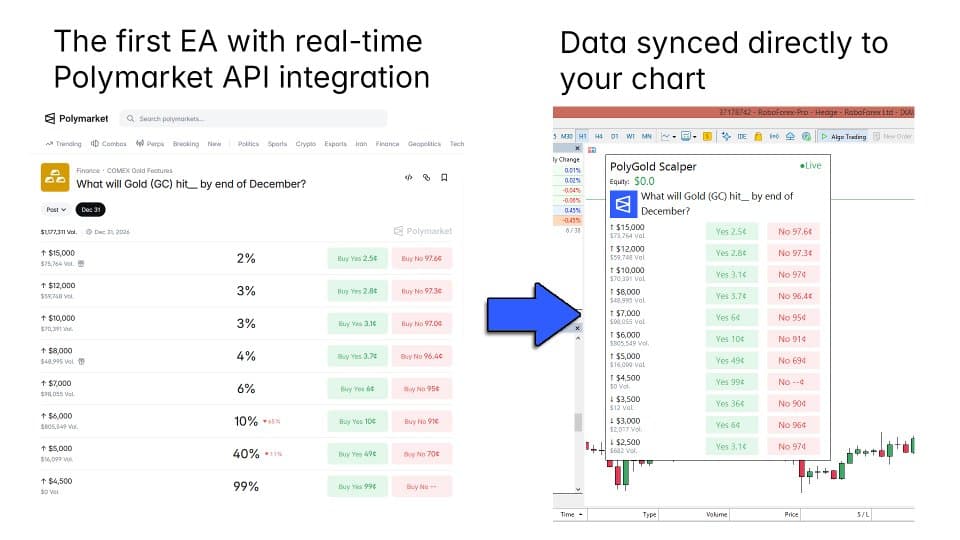
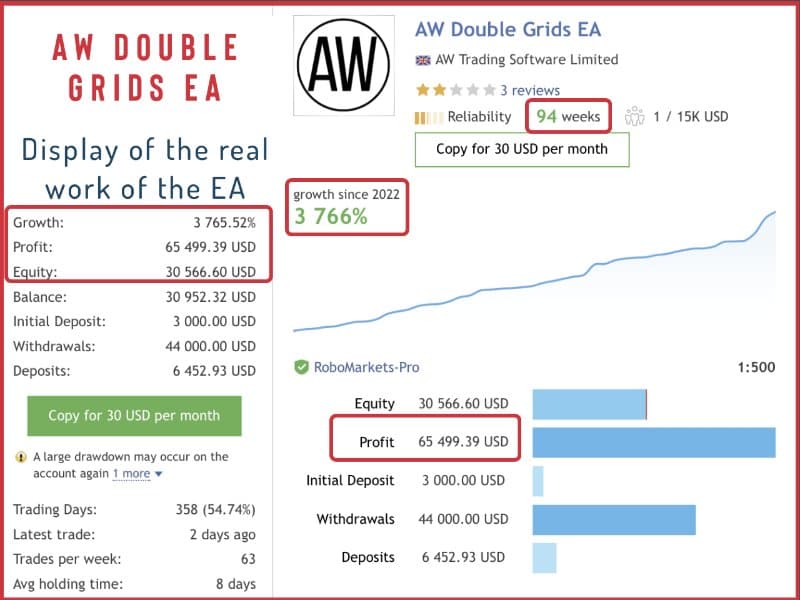

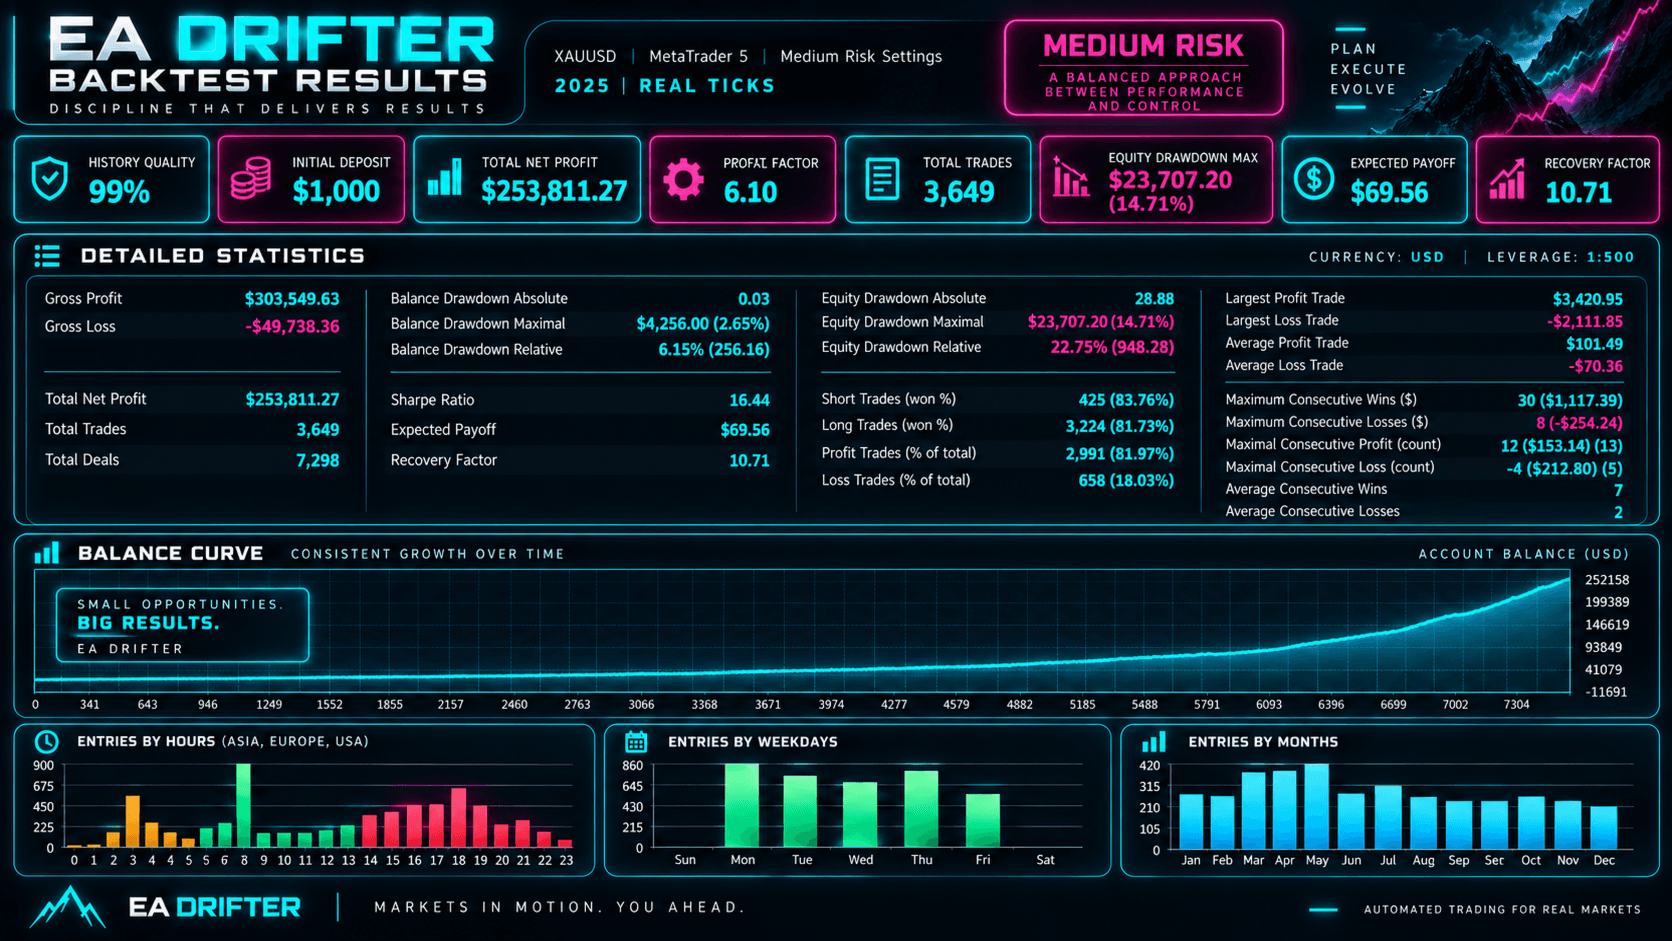

Grid and recovery expert advisors add to a position, or increase its size, when the market moves against them, then close everything once a small bounce puts the group of trades in profit. The results look calm, with long runs of winners, while the losses wait in open trades until one move turns them into a single large loss.
The names overlap, and many EAs combine them:
All of them respond to being wrong by adding exposure rather than taking the loss.
Markets retrace far more often than they run without pause, so a system that needs only a small bounce closes most baskets in profit. The balance, which counts only closed trades, climbs in steady steps. Meanwhile an open basket's loss sits in equity, so a balance graph can look flawless while equity is deep underwater. The pattern is a high win rate, small wins and an occasional loss that undoes months of them.
Take two buy grids on gold, each adding a level every $5 below the first entry. Grid A adds 0.10 lots per level. Grid B starts at 0.01 lots and doubles each time. A $1 move is worth $100 per 100-ounce lot, and costs are left out.
| Level | Below first entry | Grid A lots | Grid A floating loss | Grid B lots | Grid B floating loss |
|---|---|---|---|---|---|
| 1 | $0 | 0.10 | $0 | 0.01 | $0 |
| 2 | $5 | 0.20 | $50 | 0.03 | $5 |
| 3 | $10 | 0.30 | $150 | 0.07 | $20 |
| 4 | $15 | 0.40 | $300 | 0.15 | $55 |
| 5 | $20 | 0.50 | $500 | 0.31 | $130 |
| 6 | $25 | 0.60 | $750 | 0.63 | $285 |
| 7 | $30 | 0.70 | $1,050 | 1.27 | $600 |
| 8 | $35 | 0.80 | $1,400 | 2.55 | $1,235 |
The figures are basket totals as each level opens. Grid A's loss grows faster than the distance, because every open trade loses on every step. Grid B starts tiny and overtakes it: at level 8 it loses $255 for each further $1, against $80 for Grid A. In return it needs only about $4.84 of bounce to break even, against $17.50, which is why doubling grids win so often.
A $35 fall is within gold's range on a busy day. If both grids stop adding at 8 levels and gold falls another $15, Grid A is down $2,600 and Grid B $5,060: 26% and about 51% of a $10,000 account.
The margin calculator and pip value calculator give the figures for your settings.
A backtest is one path through history, and a grid's risk lies in the paths that didn't happen:
Test on real ticks with variable spreads, and start runs just before the strongest trends you can find. Our backtesting guide covers the settings.
A grid or recovery EA exchanges many small wins for a rare large loss. Over a long enough period, a move that reaches the basket stop is likely, so the question is whether the profit made beforehand outweighs it. Without a basket or equity stop, the broker's stop-out sets the loss, which usually means most of the account.
Adding money to rescue a deep basket raises the eventual loss, and grids on correlated pairs such as EURUSD and GBPUSD can go deep together. On prop firm accounts, equity-based limits count floating losses; see our prop firm trading page.
Our guide to grid and martingale EAs shows how to spot one from its trade history.
A recovery EA responds to a losing trade by opening a larger one, sometimes in the opposite direction, sized to win back the loss plus a small profit. Like a martingale, its position grows while it is losing, so its rare failures are large.
Balance only counts closed trades. A grid EA closes its winning baskets quickly and keeps losing ones open, so their losses sit in equity. The balance can keep rising while equity falls further below it.
It limits the number of trades and the total lot size, not the loss. Once the last level is open, every further move against the basket still costs money. Only a basket stop or a hard equity stop closes the position at a set loss.
Its exposure grows more slowly, but its loss still grows faster than the distance price travels, because every open trade loses on every step. In the example on this page, a gold grid adding 0.10 lots every $5 was $1,400 down by the eighth level.
Enough to hold the maximum number of levels, carry their margin at your leverage and absorb the loss at the basket or equity stop, with equity still well above the broker's stop-out level. Work it out from the EA's own settings rather than a quoted minimum deposit.
Educational information only, not financial advice. Trading forex and CFDs on margin carries a high risk of losing money. Read our risk warning.