
Available soon
Trend-following expert advisors and indicators for MetaTrader, how they catch long moves, why they lose in ranges, and the settings worth testing.
Expert advisors and indicators tagged for trend following in our catalog.

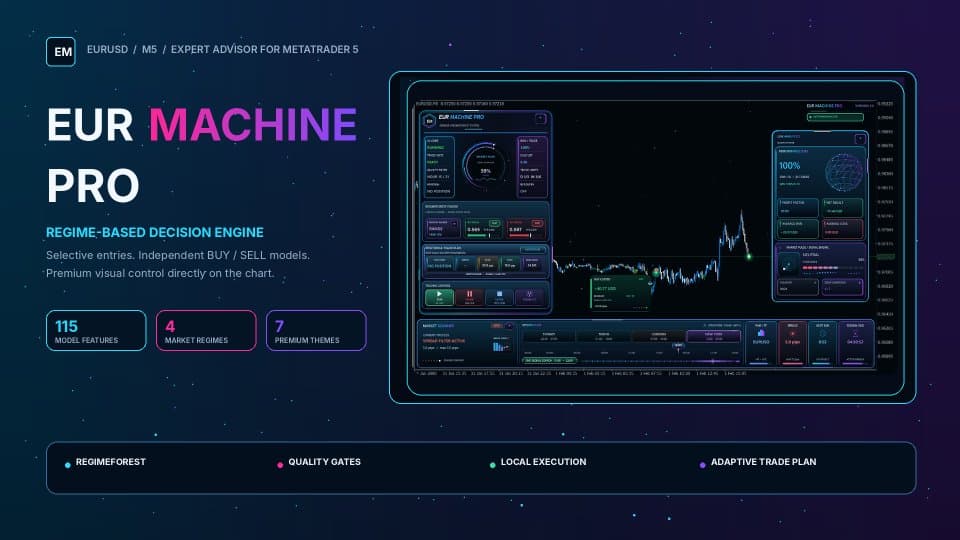

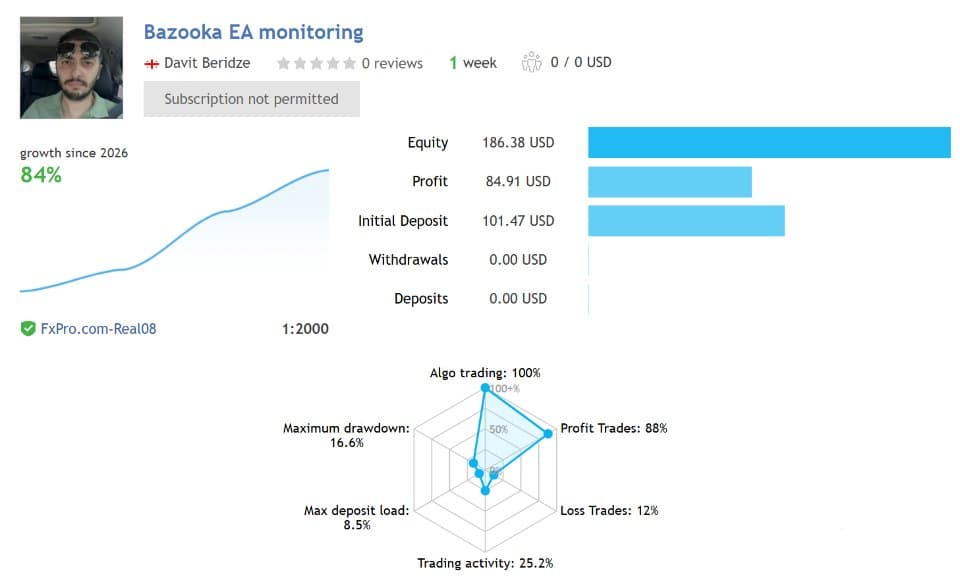

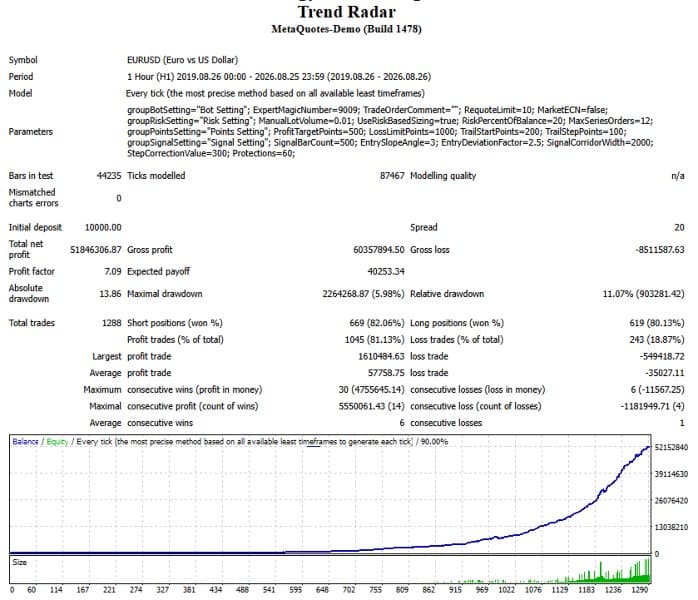
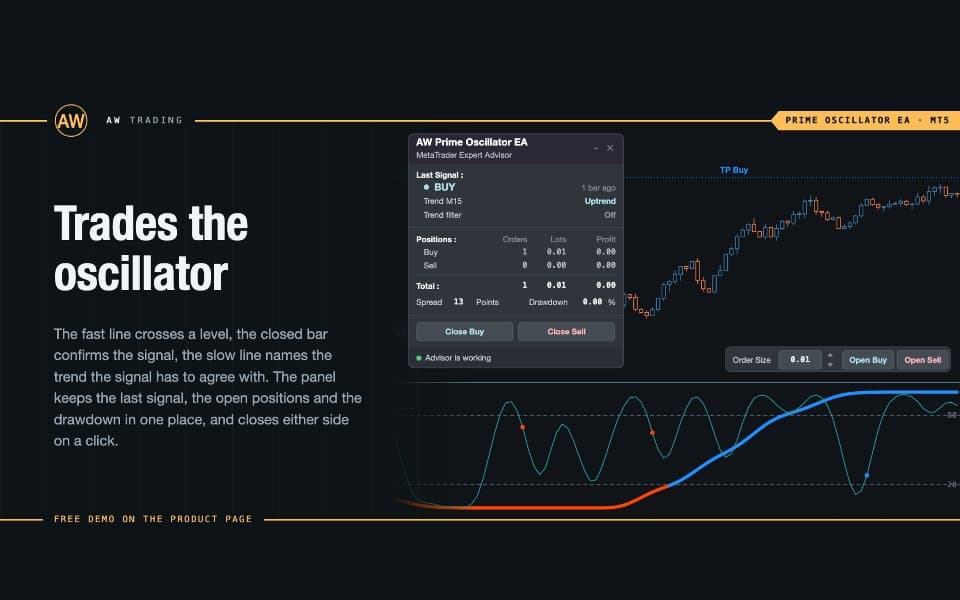
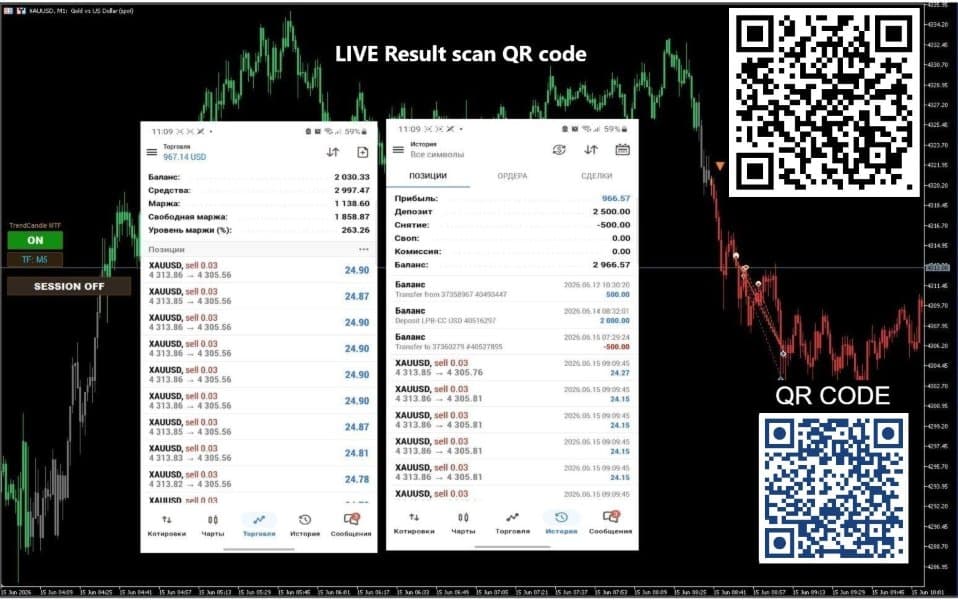
Trend following tries to catch the long moves a market makes a few times a year and stay in them while they last. A trend-following expert advisor usually loses more trades than it wins, so whether it makes money depends on its few large winners paying for many small losses.
Every trend system answers two questions: has a trend started, and has it ended? Most EAs use one of two families of rules:
Trend indicators mark direction, colour bars by trend or draw channels, and many traders use them as a higher-timeframe filter for an EA's signals. Check any colour-changing indicator for repainting first; our repainting guide shows how.
A trend system takes every signal because it can't know which one starts a long move. Most are stopped out for a small loss; the few real trends are trailed and run to several times the risk. Take a system that wins 35% of its trades, with an average win three times its average loss:
Losing streaks are long too. With a 65% chance of losing each trade, a run of ten losses somewhere in a few hundred trades is an ordinary result of chance. At 1% risk per trade, ten losses in a row take about 9.6% off the balance. The risk of ruin calculator simulates them for your own figures.
The style suits markets that make sustained directional moves, such as gold, the yen crosses and stock indices. Many traders run the same rules on several symbols, since trends arrive at different times, but pairs such as EURUSD and GBPUSD often trend, and lose, together.
Most trend EAs work on H1 to D1. Lower timeframes give more signals, but more are noise and costs take a bigger share of each move. Higher timeframes trade rarely and hold for weeks, paying or earning swap every night. Session timing matters less than for intraday styles.
Trend following earns its money in a few strong, persistent moves. Its worst periods are ranges, where price swings back and forth through every average and short channel. Each false signal costs 1R plus spread, and a range lasting a few months can produce a long string of them. That drawdown is the cost of being in the market when the next trend starts.
Sharp reversals hurt too, giving back much of an open profit before the trailing stop is hit. Range filters, such as a minimum trend-strength reading, cut some losers but delay or miss the start of some trends, so test with and without them.
With profit concentrated in a few trades, a two-year backtest may hold only one or two of the moves that make a trend system worthwhile. Test across many years and several symbols, ranges included:
For the full checklist, read how to evaluate an expert advisor.
That is how the style works. It takes every signal because it can't tell which one will become a long trend, and most are stopped out for small losses. A system that wins 35% of its trades, with winners three times the size of its losers, expects 0.40 times its risk per trade before costs.
It depends on the reward to risk. At an average of 3:1 the break-even win rate is 25%, and at 2:1 it is about 33%. Compare the EA's tested win rate with its break-even rate, and leave a margin for costs and for weaker live periods.
Months, and sometimes longer, because long ranges produce one false signal after another. Find the longest flat or losing stretch in a multi-year backtest and expect one at least as long when you trade it live.
Most trend EAs use H1 to D1. Lower timeframes trade more often, but more of their signals are noise and costs take a larger share of each move. Higher timeframes trade rarely and need many years of history to test properly.
Most trend systems trail, because a fixed target caps the large winners the strategy depends on. The trailing distance is a trade-off: a tighter trail keeps more of short moves but exits long trends early, and a looser one does the opposite. Test several distances rather than picking the single best result.
Educational information only, not financial advice. Trading forex and CFDs on margin carries a high risk of losing money. Read our risk warning.