
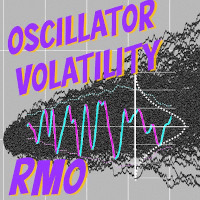

Available soon
Returns Momentum Oscillator (RMO) is an MT5 indicator that tracks the change in exponentially weighted volatility of returns and plots it around a zero line with standard deviation bands to mark possible turning points.
Get one message the moment it launches, with its price.
Returns Momentum Oscillator, or RMO, is an MT5 indicator that measures how the volatility of price returns is changing and shows the result as an oscillator around a zero line. Bands based on standard deviation mark readings that are unusually large, which traders often watch as possible turning points.
The indicator starts from price returns and builds an exponentially weighted measure of volatility. It then looks at the difference between those volatility readings. The idea behind this approach is that volatility moves in waves and that changes in returns can show up before they are obvious in price.
Several processing steps follow, each with a purpose:
Bands are drawn around the oscillator using a multiple of its own standard deviation. When the line moves beyond a band, the colour changes to flag an outlier. This works like the overbought and oversold lines on RSI, but the levels are tied to how the indicator has actually behaved recently.
Because the processed signal is close to normally distributed, it can also be compared against price for divergence, for example price making a new extreme while the oscillator does not.
RMO runs in a separate window on any symbol and timeframe available in your MT5 terminal. Behaviour will differ between instruments and between short and long timeframes, so review how it reacts on the markets you trade before using it in live decisions.
The defaults below are a starting point. Adjust one input at a time and compare results on historical data.
| Input | Default | Purpose |
|---|---|---|
| Sample size | 7 | Number of periods used to calculate volatility |
| Smoothing sample size | 8 | Number of periods used for the low-lag smoothing |
| Multiplier | 2.00 | Standard deviations used for the bands; beyond this the line changes colour |
| Sample size bands | 30 | Number of periods used to calculate the band width |
| High-pass filter sample size | 50 | Length of the filter that reduces low-frequency noise |
Trading carries risk, and past results do not predict future ones. RMO is an analysis tool that shows statistical readings and probabilities. It is not financial advice, and a band touch does not mean price will reverse. Test on a demo account and use your own risk management.
If the oscillator looks empty, scroll the chart back so the terminal loads more history, then check that the inputs are valid.
| Product type | Indicator (separate oscillator window) |
|---|---|
| Platform | MetaTrader 5 (MT5) |
| Strategy focus | Signals, Momentum, Support and resistance |
| Delivery | Download from your account after purchase |
| License key | Not needed |
| Status | Launching soon |
| Strategy tags | Signals, momentum, support and resistance |
| Markets | Any symbol available in your MT5 terminal |
| Timeframes | All standard MT5 timeframes |
| Trade style | Discretionary analysis; does not place trades itself |
| Inputs | Sample size, smoothing size, multiplier, band size, high-pass size |
| Requirements | MT5 terminal with enough price history loaded |
No reviews yet. Customers who own Returns Momentum Oscillator RMO can review it here.
No. RMO is an indicator that draws an oscillator and bands in a separate window. It does not place, modify or close orders. You decide how to use the readings within your own trading plan and risk rules.
No. This product is built for MetaTrader 5 only. An MT4 terminal cannot load it. If you trade on MT4, look for a product listed for that platform instead.
Open MT5, choose File and then Open Data Folder, go to MQL5 and then Indicators, and copy the indicator file there. Restart the terminal or refresh the Navigator, then drag RMO from the Indicators list onto a chart.
Start with the default inputs and watch how the oscillator behaves on your chosen symbol and timeframe. Change one input at a time and test on historical data and a demo account before relying on any configuration.
The indicator works on price data inside the terminal, so it is not tied to a specific broker. Symbol names, history depth and data quality differ between brokers, so check that your chart has enough history loaded.
No indicator can guarantee a reversal. Band touches show statistically unusual readings, not certain turning points. Check how the latest bar behaves in real time and review historical behaviour yourself before trading.
Returns Momentum Oscillator RMO
Notify me at launchQuestions about this tool?
Ask us on Telegram Install guide for MT4 and MT5 Get a custom version builtFree, practical help with testing, sizing and running indicators.
More MT5 tools with a similar focus.





Own Returns Momentum Oscillator RMO? Sign in to review it.