
Available soon
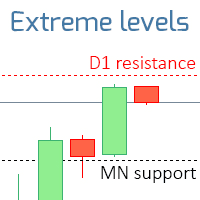
Support and Resistance Auto is an MT4 indicator that draws horizontal support and resistance lines taken from the last closed bar of the timeframes you select. It does not place trades.
Get one message the moment it launches, with its price.
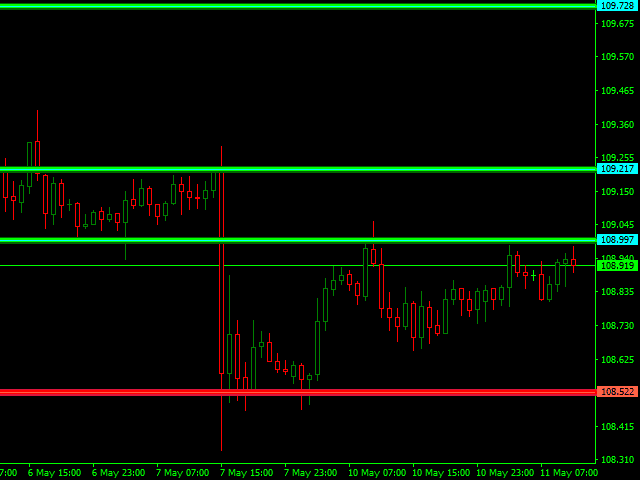
Support and Resistance Auto is an MT4 indicator that marks price levels taken from the last closed bar of the timeframes you choose. It draws them as labelled horizontal lines, so you can see higher timeframe turning points while working on a lower timeframe chart.
For each timeframe you switch on, the indicator looks at the most recent completed bar. The upper edge of that bar is drawn as a resistance level and the lower edge as a support level. Each line carries a label so you can tell which timeframe it came from.
Which mode suits you depends on how you read the chart. Some traders prefer body levels because they reflect where price settled, others prefer the full range. Try both on your own symbols and compare how price has reacted to each.
The lines are a reference for where price may pause, reverse or break through. Many traders look at candlestick patterns or other signals near these levels before acting. Because the lines come from higher timeframes, they also give context when you work on M5 or M15 charts. The indicator gives no entry or exit signals, so you need your own rules for confirmation and risk control.
The indicator can be attached to any symbol in your MT4 terminal, including forex pairs, metals, indices and others your broker offers. The levels can be drawn from M5, M15, M30, H1, H4, D1, W1 and MN. Make sure the terminal has downloaded history for each timeframe you enable, otherwise the levels may be missing or inaccurate.
The inputs are listed below. Default values may differ from one copy to another, so check them in the inputs tab after attaching the indicator.
| Input | Purpose |
|---|---|
| Timeframes | Switch each timeframe from M5 to MN on or off |
| Use real bodies | True uses open and close, false uses high and low |
| Line colours | Colour of lines and labels for each timeframe |
| Lines on background | Draws the lines behind the candles when enabled |
| Line style | Solid, dotted, dashed and similar styles |
| Line width | Thickness of the level lines |
| Font size | Size of the text labels |
Enabling many timeframes at once can crowd the chart, so start with two or three and add more only if they help.
Trading carries risk, and past results do not predict future ones. Support and resistance levels are not guarantees that price will react, and price can move through them without pausing. Test any approach on a demo account first and size positions according to your own risk limits.
If the lines do not appear, check that indicators are allowed in the terminal options and that history for the chosen timeframes has loaded.
| Product type | Indicator |
|---|---|
| Platform | MetaTrader 4 |
| Strategy focus | Support and resistance |
| Delivery | Download from your account after purchase |
| License key | Not needed |
| Status | Launching soon |
| Category | Indicator (support and resistance levels) |
| Levels shown | High and low of the last closed bar per selected timeframe |
| Level source | Candle bodies (open/close) or extremes (high/low) |
| Timeframes available | M5, M15, M30, H1, H4, D1, W1, MN |
| Markets | Any symbol available in your MT4 terminal |
| Trade style | Discretionary analysis aid, no automatic trading |
| Requirements | MT4 terminal with chart history for the timeframes used |
No reviews yet. Customers who own Support and Resistance Auto can review it here.
No. It is an indicator that draws lines and labels on the chart. It does not open, modify or close orders, so any trading decisions remain yours.
This listing is for MetaTrader 4 only. An MT4 indicator file cannot be loaded in MT5, so check that you are using the MT4 platform before buying.
It can be attached to any symbol and chart timeframe in MT4. The levels come from the timeframes you enable in the inputs, from M5 up to monthly. Make sure your terminal has loaded enough history for those timeframes.
With the real bodies option on, the levels are based on the open and close prices of the last closed bar. With it off, the levels use the high and low prices. Bodies ignore wicks, while extremes include them, so the lines will sit in different places.
Extract the downloaded archive, copy the indicator file into the MQL4 Indicators folder through File, Open Data Folder in MT4, then restart the terminal or refresh the Navigator and drag the indicator onto a chart.
Support and Resistance Auto
Notify me at launchQuestions about this tool?
Ask us on Telegram Install guide for MT4 and MT5 Get a custom version builtFree, practical help with testing, sizing and running indicators.
More MT4 tools with a similar focus.







Own Support and Resistance Auto? Sign in to review it.