

Available soon
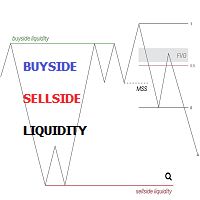
An MT5 indicator that marks buyside and sellside liquidity levels, the zones that form when they are breached, and liquidity voids on the chart. It is built around ICT-style concepts and can be used as a support and resistance reference.
Get one message the moment it launches, with its price.
Buyside Sellside Liquidity and Voids is an MT5 indicator that highlights where resting stop and pending orders may be concentrated, using the liquidity concepts taught in the ICT methodology. It also marks liquidity voids, the fast one-directional price moves that leave gaps in the chart.
The indicator scans a lookback window for swing extremes where orders tend to cluster. Buyside liquidity sits above price, where short sellers often place protective stops. Sellside liquidity sits below price, where long traders often place theirs. These areas can behave as resistance or support.
When price trades through a level, the indicator draws a zone to give more context for what may follow:
These are interpretations, not predictions, and ICT ideas may not suit every trading approach.
A void is a single candle or a run of candles in the same direction, usually with large bodies and short wicks. The indicator can show bullish and bearish voids, with an optional label. Voids are often revisited by price, but that is a tendency and not a rule.
It can be loaded on any symbol and timeframe available in your MT5 terminal. Higher timeframes give fewer, broader levels; lower timeframes give more frequent and noisier ones. Check how it behaves on your instrument before relying on it.
Exact defaults may differ, so review the inputs panel after attaching the indicator. The main groups are:
| Group | Option | Purpose |
|---|---|---|
| Liquidity levels | Detection length | Lookback period used to find levels |
| Liquidity levels | Margin | Sensitivity of level detection |
| Liquidity zones | Buyside and sellside zones | Turn each zone type on or off |
| Liquidity zones | Zone margin and colour | Zone boundaries and appearance |
| Liquidity voids | Voids and label | Show bullish and bearish voids, with an optional label |
| Display | Visible levels | How many levels and zones stay on the chart |
Alerts can be set for a level being detected or updated, and for a level being breached. Buffer 0 holds buyside data and buffer 1 holds sellside data. Values mean: 0 none, 1 detected, 2 breached, 3 price inside the zone.
Trading carries risk and past results do not predict future ones. Liquidity levels, zones and voids are analysis aids only. Test on a demo account and use your own risk management.
| Product type | Indicator |
|---|---|
| Platform | MetaTrader 5 (indicator) |
| Strategy focus | Support and resistance |
| Delivery | Download from your account after purchase |
| License key | Not needed |
| Status | Launching soon |
| Category | Indicator, support and resistance |
| Concept | ICT-style liquidity levels, zones and voids |
| Markets | Any symbol offered by your broker |
| Timeframes | Any chart timeframe |
| Trade style | Discretionary analysis, no automatic trading |
| Alerts | Level detected or updated, level breached |
| Buffers | Buffer 0 buyside, buffer 1 sellside |
No reviews yet. Customers who own Buyside Sellside Liquidity and Voids can review it here.
No. It is a charting indicator. It draws liquidity levels, zones and voids and can send alerts, but it does not place or manage orders. Any trading decision is yours.
This listing is for MetaTrader 5. An MT5 indicator cannot be loaded in MT4, so check that your terminal is MT5 before buying.
It can be attached to any symbol and timeframe your broker provides in MT5. Detection depends on the lookback and margin settings, so results will look different on each instrument and timeframe. Test on a demo chart first.
The indicator provides two data buffers, one for buyside and one for sellside liquidity. Each buffer carries a state value: none, detected, breached, or price inside the zone. An EA can read these with iCustom or a handle, but you need to code that yourself.
Copy the indicator file into the MQL5/Indicators folder through File, Open Data Folder in MT5. Refresh the Navigator or restart the terminal, then drag the indicator onto a chart and adjust the inputs.
No. Liquidity levels and zones are reference areas, and price may reverse, stall or move straight through them. Trading carries risk and past results do not predict future ones.
Buyside Sellside Liquidity and Voids
Notify me at launchQuestions about this tool?
Ask us on Telegram Install guide for MT4 and MT5 Get a custom version builtFree, practical help with testing, sizing and running indicators.
More MT5 tools with a similar focus.






Own Buyside Sellside Liquidity and Voids? Sign in to review it.