
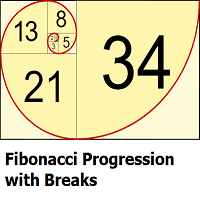

Available soon
An MT5 indicator that tracks a central price level and marks each deviation from it, with the distance scaled by successive Fibonacci numbers. It also draws upper and lower bands that can serve as support and resistance.
Get one message the moment it launches, with its price.
Fibonacci Progression with Breaks is an indicator for MetaTrader 5 that follows a central price level and measures how far price moves away from it. Each time price travels beyond a set distance, that distance is scaled by the next number in the Fibonacci sequence, and the event is marked on the chart.
The indicator keeps a central level and builds an upper and a lower extremity around it, using a threshold distance. That distance can be fixed by you or derived from market volatility. As price pushes outside the extremities, the indicator records the move and widens the threshold using the next Fibonacci value, so each further deviation has to be larger than the last to be counted.
The central level also gives a simple trend reading. If the level is higher than its previous value, the indicator treats the market as being in an uptrend. If it is lower, it treats the market as being in a downtrend.
When an uptrend is detected and price deviates significantly upward, a checkmark is drawn together with the Fibonacci multiplier in use. If price deviates downward instead, a cross is drawn. The distance threshold is then multiplied by the next value in the sequence. The reverse logic applies in a downtrend.
If price deviates so many times that the sequence grows longer than your Sequence Length setting, a break label is shown. At that point the indicator starts a new central level based on the current closing price and resets the Fibonacci multiplier to 1.
The tool works from price data, so it can be attached to any symbol and timeframe in your MT5 terminal. The right distance differs a lot between instruments and chart periods, so do not copy a setting from one chart to another without checking how the bands sit against recent price.
| Input | What it does |
|---|---|
| Method | Chooses how the base distance is set: Manual or ATR. |
| Size | Distance in points when Method is Manual, or a multiplier of the ATR value when Method is ATR. |
| Sequence Length | The maximum number of significant deviations allowed before a break occurs. |
| Notification settings | Controls the alerts the indicator can send. |
| Style settings | Colours and appearance of the levels and labels. |
Exact default values are not listed here, so open the inputs tab after loading the indicator and note the defaults before changing them.
The upper and lower extremities drawn from the central level and threshold distance can be treated as possible support and resistance zones. A reaction at one of these lines is not a signal on its own. Many traders compare it with market structure, higher timeframe levels or their own entry rules.
Trading carries risk, and you can lose some or all of your capital. This indicator displays levels and labels based on past prices. Past results do not predict future ones, and no setting will remove the chance of loss. Test on a demo account first and size positions to a loss you can accept.
| Product type | Indicator |
|---|---|
| Platform | MetaTrader 5 |
| Strategy focus | Trend, Support and resistance |
| Delivery | Download from your account after purchase |
| License key | Not needed |
| Status | Launching soon |
| Category | Indicator (not an automated trading system) |
| Strategy tags | Trend, support and resistance |
| Distance methods | Manual (points) or ATR multiple |
| Markets | Any symbol available in your MT5 terminal |
| Timeframes | Any chart timeframe; test the settings on each one |
| Alerts | Notification settings built in |
| Requirements | MT5 desktop terminal with enough chart history loaded |
No reviews yet. Customers who own Fibonacci Progression with Breaks for MT5 can review it here.
No. It is a chart indicator that draws a central level, marks deviations and shows break labels. Any trading decision, order entry and risk management remain with you.
No. This listing is built for MetaTrader 5. An MT4 terminal cannot load it, so check that you are using MT5 before you buy.
With Manual, the Size setting is a fixed distance in points. With ATR, Size is a multiplier applied to an average true range value, so the distance adapts to current volatility. Check the input descriptions in the indicator for the exact ATR period used.
A break appears when price has deviated far enough that the sequence is longer than your Sequence Length setting. The indicator then places a new central level at the current close and restarts the Fibonacci multiplier at 1.
It should load on any broker's MT5 terminal, since it reads only price data. Symbol names, digits and point sizes differ between brokers, so review the Manual distance in points on each account.
The vendor description does not say, so test it yourself. Run it on a demo account or in the Strategy Tester visual mode and compare marks on closed bars with what you saw as they formed.
Fibonacci Progression with Breaks for MT5
Notify me at launchQuestions about this tool?
Ask us on Telegram Install guide for MT4 and MT5 Get a custom version builtFree, practical help with testing, sizing and running indicators.
More MT5 tools with a similar focus.




Own Fibonacci Progression with Breaks for MT5? Sign in to review it.